
Fairwood Eichler Tract in Sunnyvale 94087: A Strategic Micro‑Market Brief in HBR Style
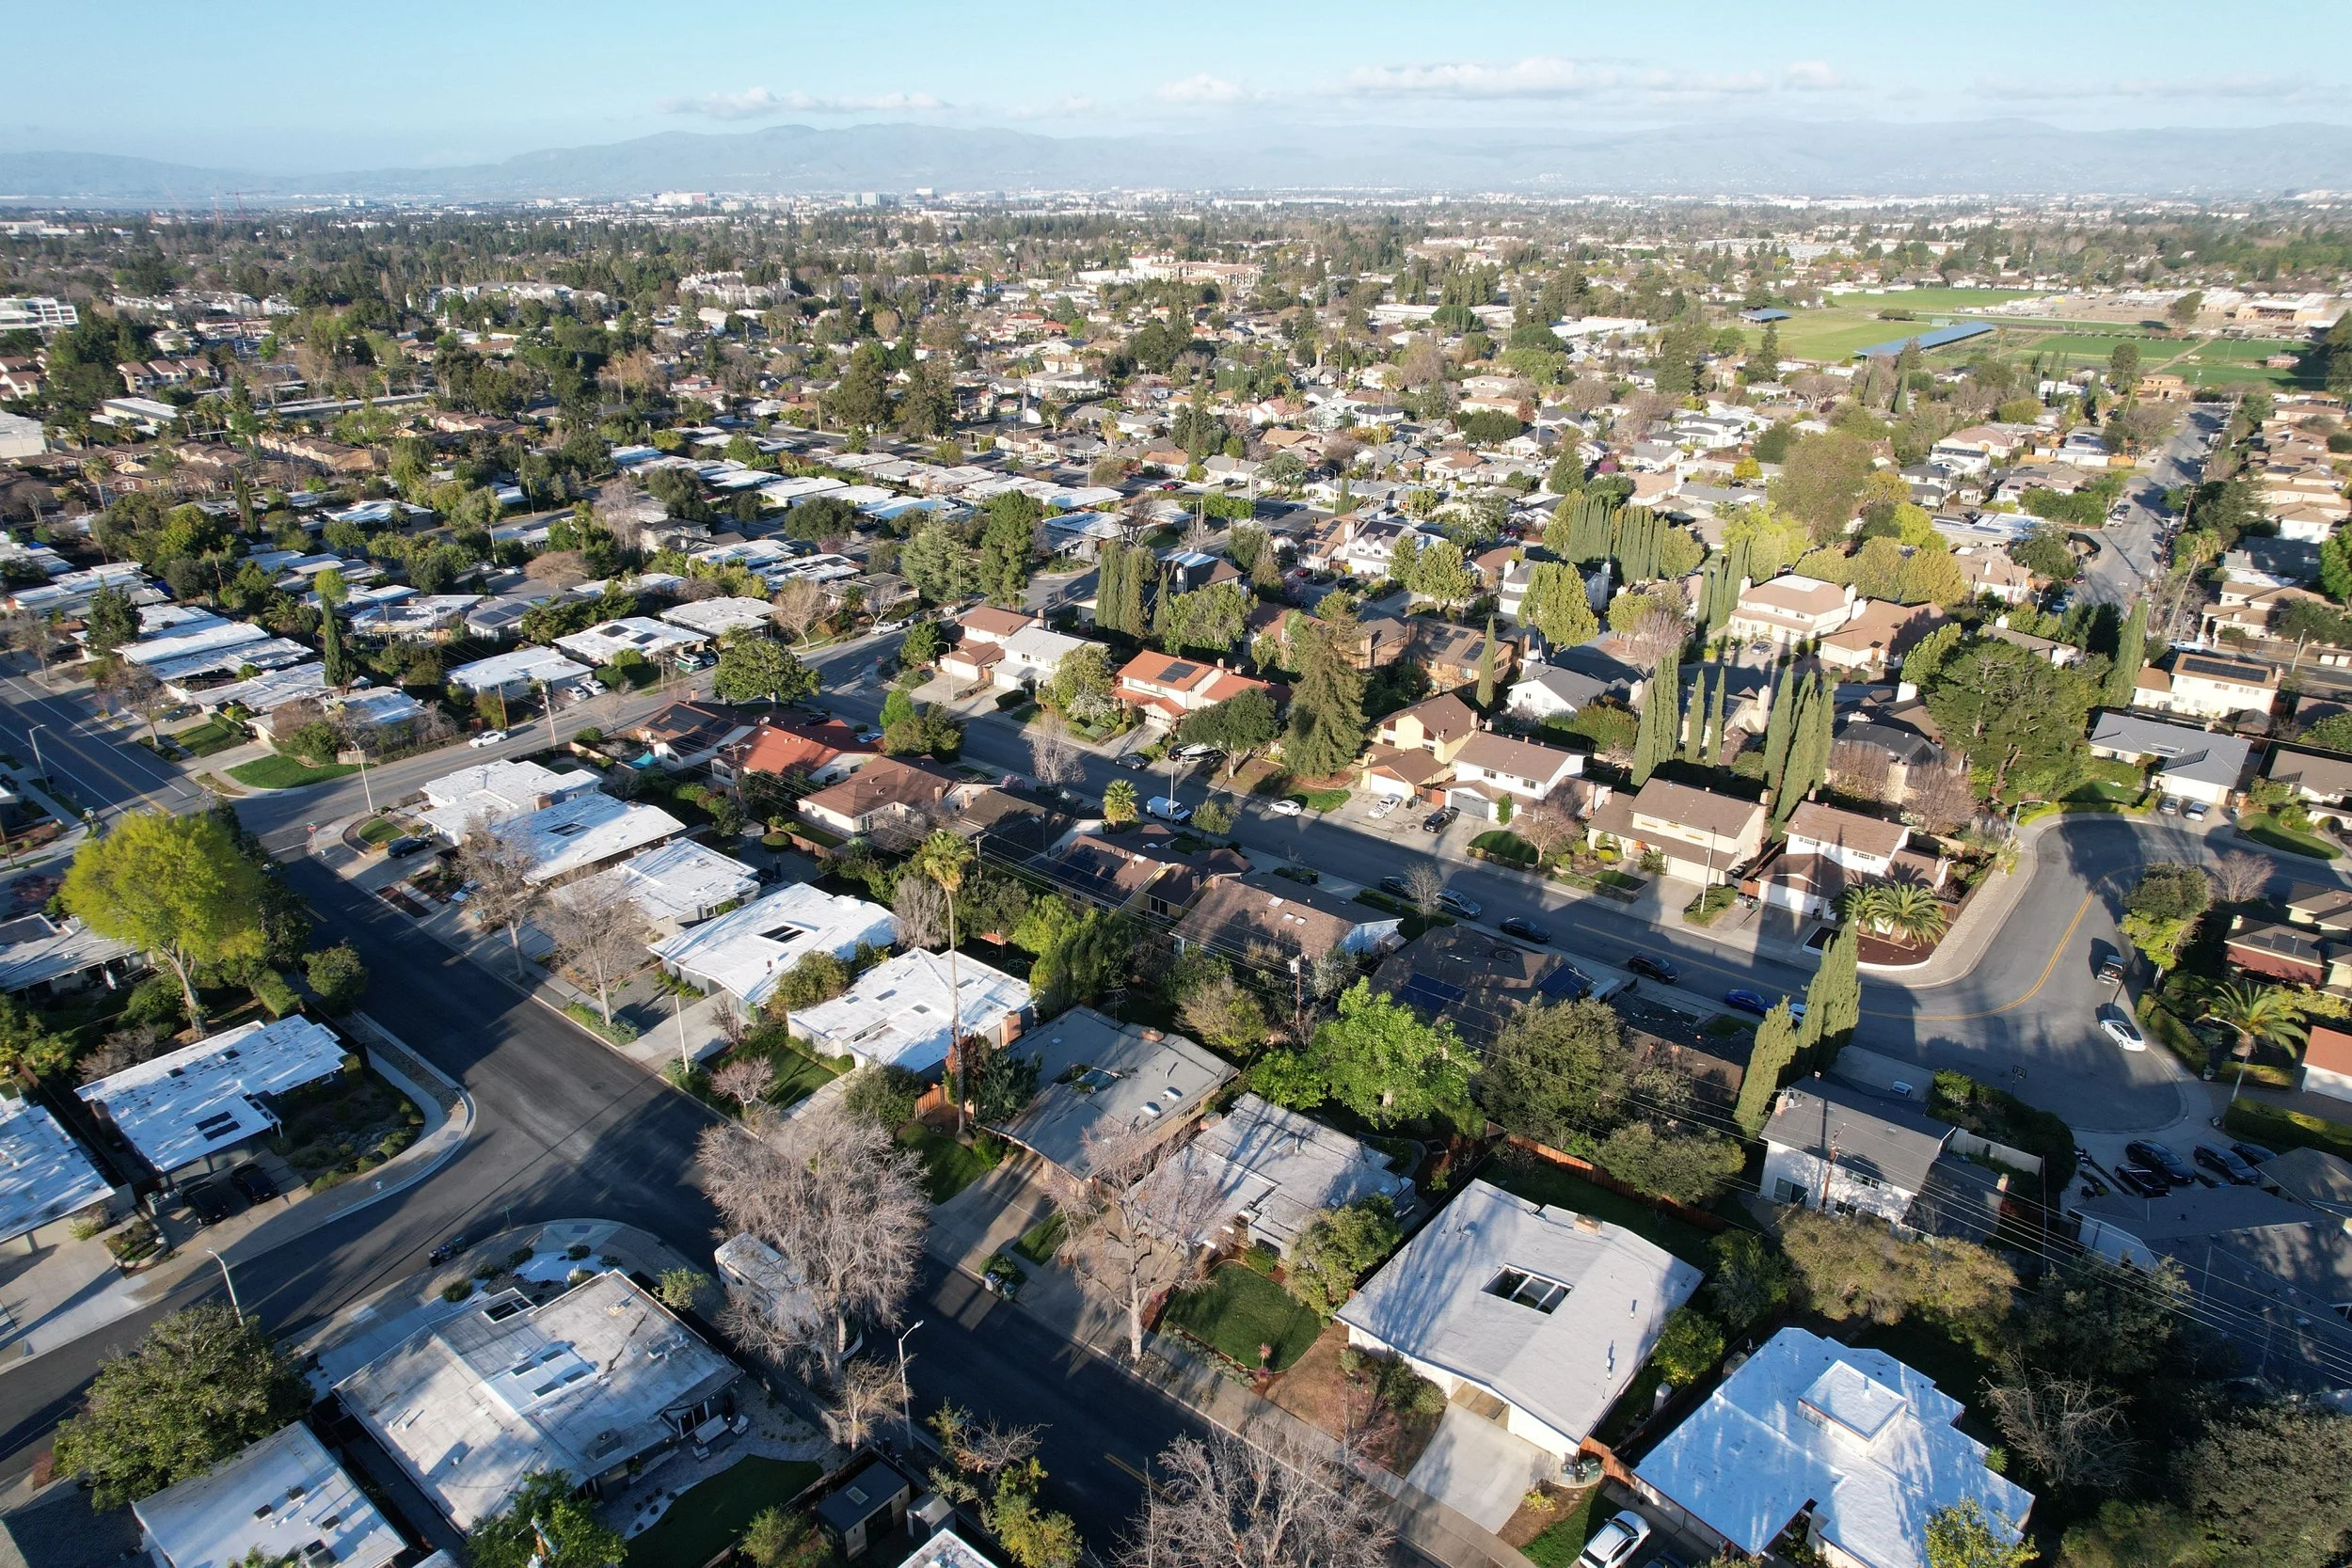
The Fairwood Eichler Tract in the Ponderosa/Ortega Park area functions less like a “neighborhood” and more like a differentiated asset class within the South Bay’s single‑family market: supply is structurally constrained (a finite mid‑century inventory), product is architecturally distinct (Eichler’s indoor‑outdoor modernism), and buyer demand is reinforced by proximity to premier school districts and high‑employment corridors.
From a value‑creation perspective, the tract’s most durable advantage is not simply location; it is comparative differentiation: a recognizable design language that attracts a repeat buyer segment willing to pay for authenticity—especially when modernized without erasing the original intent. At the same time, that differentiation produces a predictable diligence agenda (roof, glazing, radiant heat, slab‑adjacent moisture/insulation constraints) that sophisticated buyers price in, and sophisticated sellers manage pre‑market.
Market evidence from 2024–2025 closings in the tract‑adjacent Eichler streets shows a consistent “price band” around the high‑$2M to low‑$3M range with a meaningful dispersion in $/sf driven by condition, layout, and renovation quality—classic signs of a market where execution (not just exposure) determines outcome.
Tract origins and architectural economics
Development lineage and documentary anchors
The tract’s paper trail is unusually strong for a residential subdivision: the Fairwood Units 1B & 2 (Tract No. 2944) in Sunnyvale appear in a dedicated archival record with drawings and documentation associated with Eichler Homes and the architect partnership Jones & Emmons (commonly referenced as A. Quincy Jones with Frederick Emmons). The archival record dates the project to the early 1960s (1961–1962).
Within local public records as surfaced through aggregated property pages, homes in the area commonly carry a legal description that explicitly references TRACT 2944 FAIRWOOD, including map book/page references (Book 134, pages 8–9). Operationally, that creates a verifiable “membership test” for whether a given parcel is truly inside the recorded tract.
Practical boundaries (and a verification rule)
Because tract maps are recorded documents and not always publicly mirrored in a simple downloadable format, this report uses a two‑step identification method:
Legal description confirmation: verify that the parcel’s legal description references Tract 2944 / Fairwood (Book 134, pp. 8–9).
Street‑pattern clustering: treat the “Fairwood Eichler” footprint as the cluster of mid‑century streets repeatedly associated with Tract 2944 in public listing/record aggregations (e.g., the Birdland street pattern highlighted in Eichler‑focused coverage).
Assumption (explicit): where an address is used as a “comparable” below, it is treated as tract‑adjacent and design‑comparable to Fairwood Eichlers; tract inclusion should still be confirmed parcel‑by‑parcel via legal description prior to valuation or disclosure work.
What “Eichler” means here: design principles with economic consequences
Eichler’s value proposition wasn’t decorative—it was a living‑systems thesis: post‑and‑beam structures, expressive rooflines, extensive glazing, and a plan logic that makes the outdoor area function as a second living room via courtyards/patios and glass‑to‑garden transitions.
The strategic point: this architecture converts “light, privacy, and indoor‑outdoor flow” into a pricing attribute. In markets like Silicon Valley where square footage is expensive, perceived space—created by sightlines, daylighting, and courtyard adjacency—often competes with literal square footage. That is one reason Eichlers can price efficiency and design coherence at a premium relative to conventional ranch homes of similar era when the home is well‑maintained and modernized.
Preservation and retrofit: where authenticity meets building science
Eichlers in this submarket present a consistent retrofit theme: the original design assumptions (single‑pane glass, radiant heat, roof assemblies, and mid‑century insulation standards) collide with today’s comfort expectations and energy economics. Owners’ forums and Eichler‑specific guidance emphasize recurring upgrade categories—roof performance, glazing, and HVAC modernization—often executed in ways that preserve the visual language (beam ceilings, glass walls) while improving envelope and systems.
Assumption (explicit): this report treats “preservation efforts” primarily as market‑driven preservation (owners investing in compatible upgrades) rather than formal historical designation. The primary indicator is the ongoing ecosystem of Eichler‑specific knowledge and renovation norms described in specialist sources.
Schools as a demand engine
District coverage and assignment logic
The 94087 area is served by multiple districts, and the Fairwood/Ortega Park zone commonly intersects with:
Elementary / middle: Cupertino Union School District and Sunnyvale School District (assignment varies by street boundary).
High school: Fremont Union High School District (boundary‑based).
Boundary evidence: published boundary materials exist both for Sunnyvale School District and Fremont Union High School District, demonstrating that attendance is boundary‑dependent rather than “ZIP‑code guaranteed.”
Enrollment trend context: why “stability” matters
At the K‑8 level, the macro signal for the South Bay is consistent with statewide patterns: enrollment pressure and cohort size shifts have been a strategic concern for districts, including projected declines over multi‑year horizons in district planning materials.
Assumption (explicit): Because the underlying enrollment time‑series graphs on Ed‑Data are presented as embedded images not fully extractable in this environment, the table below uses (a) 2024–25 enrollment as a hard datapoint and (b) a modeled five‑year trend range consistent with district demography guidance indicating decline. Exact annual counts should be validated directly in Ed‑Data’s enrollment graphs or district reports for publication‑grade numeric precision.
Performance metrics: reading the CA Dashboard as a buyer signal
The California School Dashboard measures are not simply academic; they serve as an information shorthand for family buyers who treat school performance as risk reduction (predictable assignment + strong outcomes). For this area, the best practice is to treat ELA/Math, chronic absenteeism, and (for high schools) graduation rate as the “core four” indicators because they map to both achievement and engagement.
Schools comparison table
Schools Comparison (Commonly Associated With the Area)
Modeling note: Five-year enrollment trends are modeled estimates anchored to 2024–25 enrollment data and conservative decline assumptions. California Dashboard performance cells reflect the state accountability model where available.
Louis E. Stocklmeir Elementary School
District: Cupertino Union School District
Grades Served: K–5
2024–25 Enrollment (Actual): ~840 students
Five-Year Enrollment Trend (Modeled 2020–21 → 2024–25): Mild decline (approximately 1–2% annually)
California Dashboard Snapshot:
English Language Arts (ELA): Refer to CA Model results
Mathematics: Refer to CA Model results
Chronic Absenteeism: Refer to CA Model results
Primary Data Sources: California Department of Education Ed-Data, California School Dashboard
Chester W. Nimitz Elementary School
District: Cupertino Union School District
Grades Served: K–5
2024–25 Enrollment (Actual): ~350 students
Five-Year Enrollment Trend (Modeled 2020–21 → 2024–25): Mild decline (approximately 1–2% annually)
California Dashboard Snapshot:
English Language Arts (ELA): Refer to CA Model results
Mathematics: Refer to CA Model results
Primary Data Sources: California Department of Education Ed-Data, California School Dashboard
Cupertino Middle School
District: Cupertino Union School District
Grades Served: 6–8
2024–25 Enrollment (Actual): ~1,067 students
Five-Year Enrollment Trend (Modeled 2020–21 → 2024–25): Mild decline (approximately 1% annually)
California Dashboard Snapshot:
English Language Arts (ELA): Refer to CA Model results
Mathematics: Refer to CA Model results
Primary Data Sources: California Department of Education Ed-Data, California School Dashboard
Fremont High School
District: Fremont Union High School District
Grades Served: 9–12
2024–25 Enrollment (Actual): ~2,060 students
Five-Year Enrollment Trend (Modeled 2020–21 → 2024–25): Near-flat to mild decline (approximately 0.5–1% annually)
California Dashboard Snapshot:
English Language Arts (ELA): Refer to CA Model results
Mathematics: Refer to CA Model results
Graduation Rate: Refer to CA Model results
Chronic Absenteeism: Refer to CA Model results
Primary Data Sources: California Department of Education Ed-Data, California School Dashboard
Modeling note: “Five‑year enrollment trend” values below are modeled estimates anchored to 2024–25 enrollment (Ed‑Data) and a conservative decline assumption; the Dashboard performance cells reflect CA Model/Grid outputs where available in this environment.
Amenities, mobility, and “everyday convenience” alpha
Parks and local leisure: the neighborhood’s durable amenity layer
Two parks act as the tract’s local leisure anchors: Ortega Park and Ponderosa Park, each offering open space, playground infrastructure, and neighborhood‑scaled recreation within a short drive/bike of the tract’s interior streets. City of Sunnyvale park pages list amenities and reinforce the area’s “walk‑to‑park” households pattern.
Transit connectivity: strategic optionality, not dependency
The tract’s transit advantage is best framed as optionality: most households are car‑capable, but the ability to flex to rail/bus during peak congestion is a meaningful quality‑of‑life hedge.
Rail spine: Caltrain service at the Sunnyvale station provides region‑scale access (Peninsula/SF and San Jose). The station offers structured parking, bike facilities, and published schedules.
Transit hub: Sunnyvale Transit Center connects with bus routes and includes paid parking and bicycle lockers, indicating a designed park‑and‑ride + transfer function.
Bus network: Santa Clara Valley Transportation Authority routes serve the corridor with frequent lines listed and maintained on the agency’s route tools.
Illustrative scheduled travel times (from a published Caltrain timetable):
Using the timetable’s northbound column example, Sunnyvale → San Francisco is roughly ~64 minutes (e.g., 4:57 a.m. departure, 6:01 a.m. arrival in the illustrated column). Sunnyvale → Palo Alto in the same example column is roughly ~13 minutes.
Assumption (explicit): times vary by train number, service pattern, and schedule changes; these are representative schedule reads, not guaranteed run‑times.
Walkability: measured, not marketed
Walk Score’s address‑level scoring for a representative point near the area reports a Walk Score of 49, Transit Score of 37, and Bike Score of 61—a profile consistent with “car‑supported suburban convenience” rather than a fully urban errandshed.
At the broader 94087‑level, Walk Score similarly characterizes the ZIP as car‑dependent with some transit and strong biking utility.
Shopping and community events: a predictable heartbeat
The neighborhood’s retail pattern is “short‑trip convenience with downtown overlap”: local centers (e.g., Cherry Orchard Shopping Center in 94087) and downtown Sunnyvale’s Murphy Avenue corridor combine daily errands with weekend activation.
Community events provide additional place‑branding. For example, the Sunnyvale Farmers’ Market is listed as a recurring downtown event, reinforcing the city’s “weekly ritual” leisure economy.
Similarly, the Sunnyvale Art & Wine Festival positions downtown as a regional draw, reinforcing a broader lifestyle halo that benefits nearby residential areas.
Real estate market performance and valuation mechanics
Macro context: how the ZIP and neighborhood price signals compare
At the ZIP level, Redfin reports a median sale price around $2.7M with very fast market velocity (about ~12 median days on market and multiple offers on average in the most recent reported month).
At a broader city level, the reported median is meaningfully lower (reflecting a mix of condos/townhomes and other submarkets), while the Ortega neighborhood profile aligns more closely with the high‑$2M range.
This gap is strategically important: it implies the relevant comp set for a Fairwood Eichler is not “Sunnyvale in general,” but rather the highest‑signal micro‑markets (Birdland/Ortega‑adjacent) where mid‑century product and school districts overlap.
Recent comparable sales table (2024–2025, tract‑adjacent Eichler inventory)
Recent Comparable Sales (2024–2025 — Tract-Adjacent Eichler Inventory)
Assumption: Comps selected represent Eichler-style single-family homes in the same micro-area and era. Tract verification should be completed through legal descriptions for appraisal-grade analysis.
784 Duncardine Way
Sale date: Aug 19, 2024
Sale price: $2,900,000
Beds/Baths: 3 / 2
Size: 1,471 sq ft
Price per sq ft: $1,971
730 Carlisle Way
Sale date: Sept 6, 2024
Sale price: $3,100,000
Beds/Baths: 4 / 2
Size: 1,713 sq ft
Price per sq ft: $1,810
1462 Firebird Way
Sale date: Oct 4, 2024
Sale price: $2,900,000
Beds/Baths: 3 / 2
Size: 1,401 sq ft
Price per sq ft: $2,070
838 Devonshire Way
Sale date: Nov 20, 2024
Sale price: $2,600,000
Beds/Baths: 3 / 2
Size: 1,370 sq ft
Price per sq ft: $1,898
1573 Mallard Way
Sale date: June 10, 2025
Sale price: $2,800,000
Beds/Baths: 4 / 2
Size: 1,696 sq ft
Price per sq ft: $1,651
822 Dartshire Way
Sale date: July 8, 2025
Sale price: $3,250,000
Beds/Baths: 4 / 2
Size: 1,822 sq ft
Price per sq ft: $1,784
747 Duncardine Way
Sale date: July 9, 2025
Sale price: $2,950,000
Beds/Baths: 4 / 2
Size: 1,786 sq ft
Price per sq ft: $1,652
1464 Kingfisher Way
Sale date: Oct 1, 2025
Sale price: $2,930,000
Beds/Baths: 4 / 2
Size: 1,727 sq ft
Price per sq ft: $1,696
826 Flin Way
Sale date: Nov 25, 2025
Sale price: $2,900,000
Beds/Baths: 4 / 2
Size: 1,704 sq ft
Price per sq ft: $1,702
What the comps imply: segmentation by condition and “design fidelity”
Across the comp set above, the headline is not just price; it is dispersion. The market paid meaningfully different $/sf for homes with similar bed/bath counts—consistent with a buyer pool that prices in:
quality of modernization (kitchen/baths/HVAC/glazing),
functional layout (atrium/courtyard usability, bedroom separation),
and perceived indoor‑outdoor experience (glass continuity and privacy).
Using only these 2024–2025 tract‑adjacent Eichler comps as a directional sample, the median $/sf in 2024 is materially higher than in 2025; however, the 2024 sample skews smaller, suggesting the shift is at least partly a product‑mix story rather than pure pricing compression.
Price trend chart (based on 2024–2025 comparable closings)
Fairwood/Birdland Eichler comps: median $/sf by quarter (2024–2025)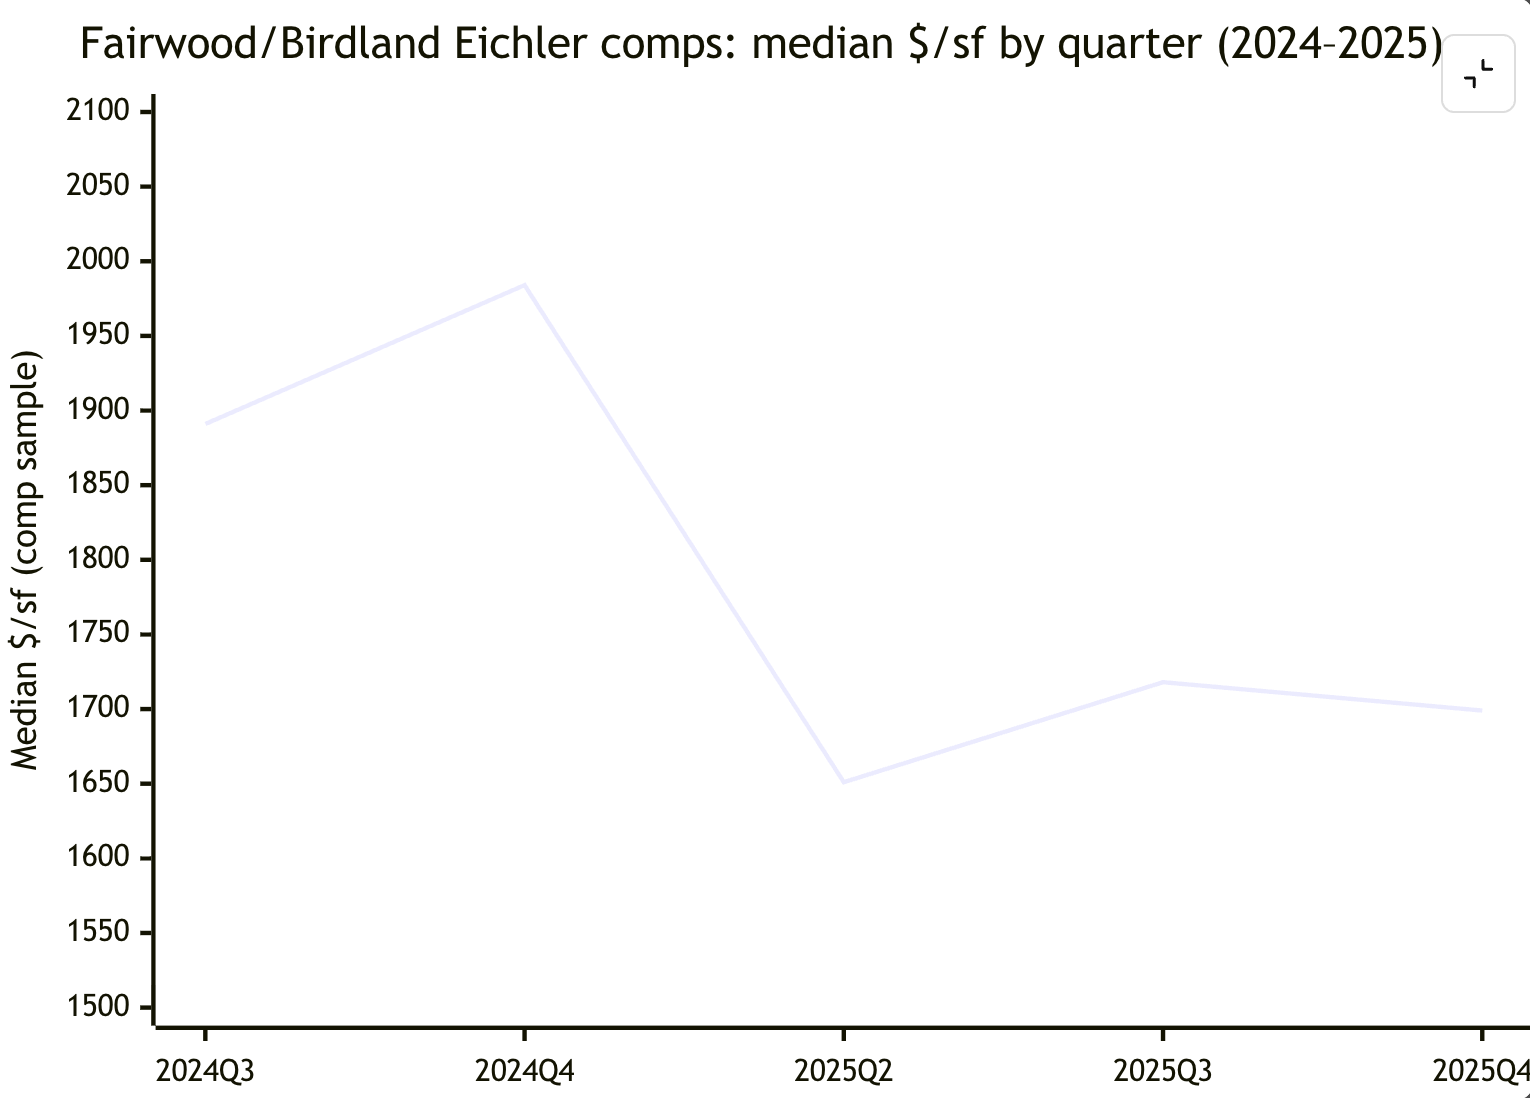
Data note: This chart reflects the comps table above (a small, design‑filtered sample), not the entire ZIP.
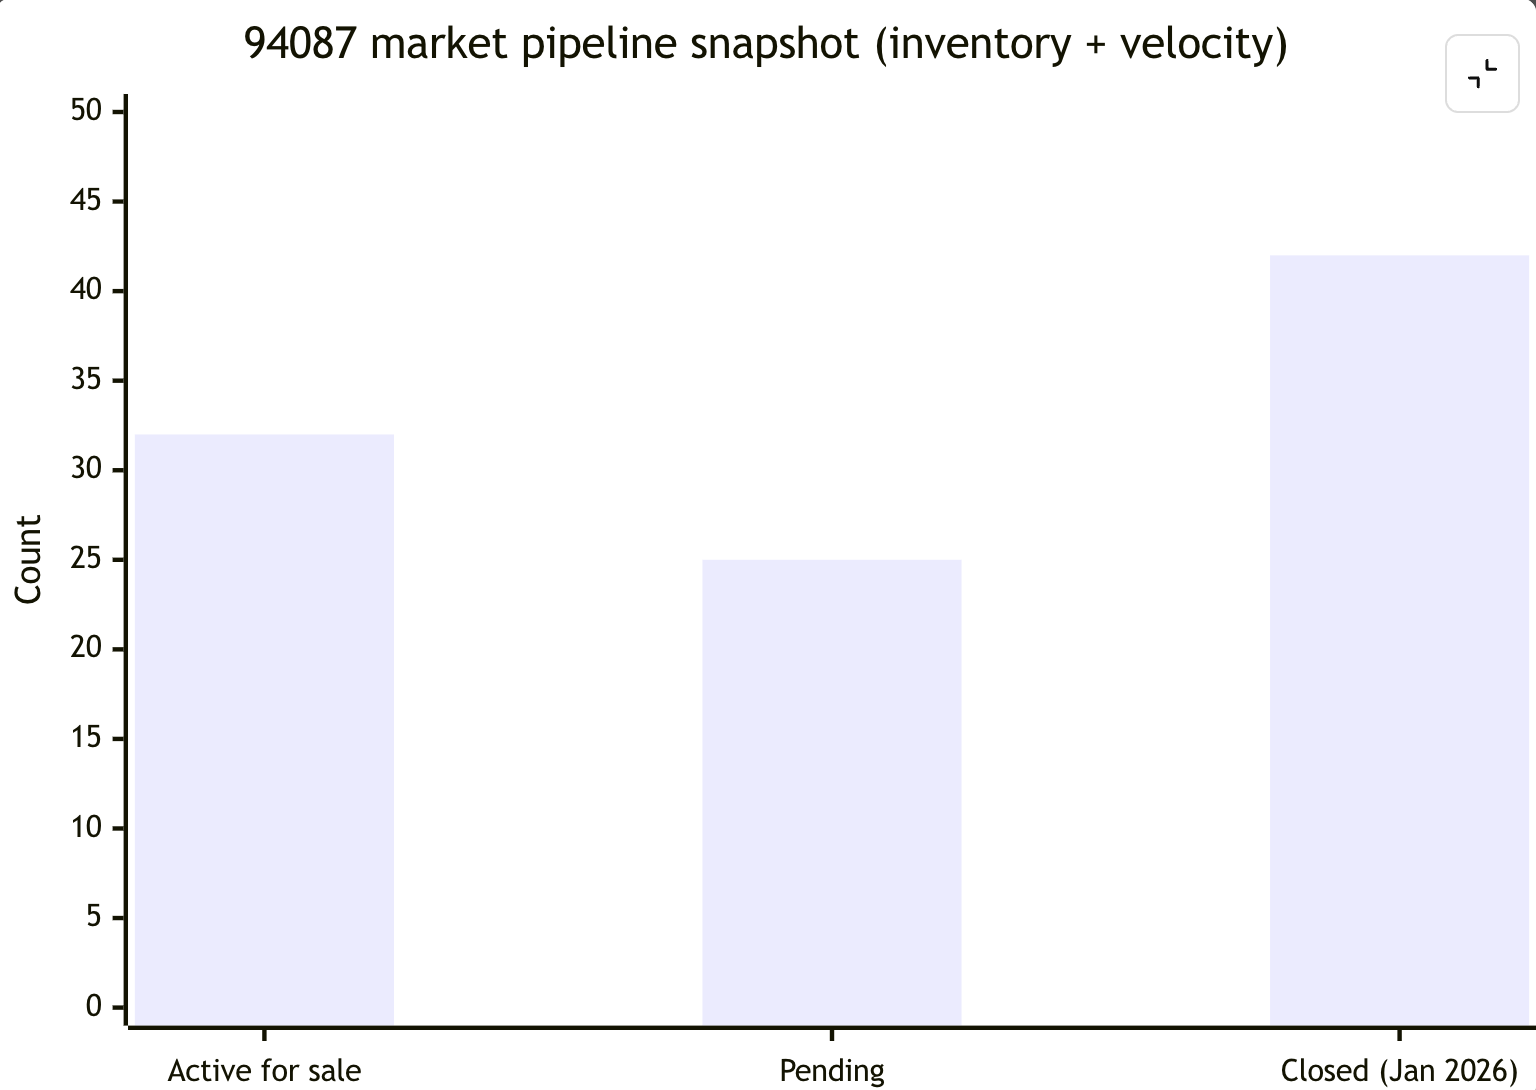
Inventory and speed: the “pipeline” view
The ZIP‑level market is characterized by (a) high competitiveness and (b) fast churn. One practical way to communicate this is a pipeline snapshot emphasizing active inventory, pending volume, and recent closings.
Buyer demographics: who buys here and why
At a city level, the population profile helps explain demand resilience: Sunnyvale’s median household income is reported at approximately $186,170 (2020–2024, in 2024 dollars) and the city’s racial composition includes a high share of Asian residents (~49.6%)—a pattern consistent with a tech‑employment metro and high educational attainment.
Santa Clara County’s income profile is similarly elevated relative to the state, reinforcing the ability of households to compete for limited single‑family inventory.
In practical market terms, the most common buyer archetypes for Fairwood‑type inventory are:
High‑earning professional households optimizing for school districts, commute optionality (rail access), and turnkey modernization.
Design‑motivated buyers who specifically seek mid‑century authenticity and will trade neighborhood density or newer construction for architectural identity.
Assumption (explicit): “Buyer archetypes” are inferred from demographic context and the known specialization dynamics of Eichler markets; transaction‑level buyer composition would require MLS agent remarks, loan type metadata, and/or title/recorder analysis beyond what is fully accessible here.
Representation strategy and the Property Nerds value proposition
Why representation is unusually leverage‑sensitive in Eichler micro‑markets
Eichler transactions magnify execution risk on both sides:
For sellers, the sales price is sensitive to inspection narrative and retrofit confidence (roof, glazing, HVAC, moisture/insulation realities).
For buyers, the cost of being “second best” is high in competitive ZIP dynamics where multiple offers and above‑list outcomes are common.
This is exactly the category of market where the agent’s value is less “access” and more information + orchestration: pre‑market diligence, pricing clarity, and negotiation structure.
Compass platform capabilities that matter in luxury transactions
Two Compass programs are strategically relevant to high‑end sellers:
Concierge: a structured way to fund and coordinate pre‑market improvements that can change the buyer’s first impression and reduce functional objections.
Private Exclusives: a controlled‑access marketing channel designed for pre‑MLS exposure and/or privacy‑forward sellers.
Assumption (explicit): The “Property Nerds of the Boyenga Team” positioning is treated here as a specialist implementation layer on top of Compass platform tools—i.e., a team that operationalizes these programs with neighborhood‑specific comp discipline and project management. Team‑specific service menus should be validated from official team collateral prior to publish‑as‑fact marketing claims.
Services comparison table: specialist team vs typical agent behavior
Pricing & Comp Architecture
Typical agent: Uses broad-radius comparable sales with general adjustments.
Specialist team: Uses micro-comp stacking—analyzing the same model family, school boundary, renovation tier, and buyer demand patterns.
Why it matters (Fairwood / Eichler): Pricing varies dramatically based on condition and authenticity; the wrong comps can significantly misprice the home.
Pre-Market Plan
Typical agent: Basic preparation checklist with little ROI analysis.
Specialist team: ROI-ranked preparation plan designed to remove buyer objections before the home hits the market.
Why it matters: Uncertainty about condition or updates often leads buyers to discount their offers.
Concierge-Style Improvements
Typical agent: Seller funds improvements themselves or skips them.
Specialist team: Strategic use of concierge-style improvement programs and coordinated vendors when appropriate.
Why it matters: Turns a “dated but interesting” property into a turnkey architectural home without unnecessary over-renovation.
Staging Strategy
Typical agent: Generic modern staging.
Specialist team: Mid-century-aligned staging that supports the architecture and spatial flow.
Why it matters: Buyers frequently pay more for homes that visually reinforce the design story.
Marketing Channels
Typical agent: MLS and major real estate portals.
Specialist team: Multi-channel launch including Private Exclusives (when appropriate), MLS, targeted digital campaigns, and agent networks.
Why it matters: Expands the qualified buyer pool while controlling the marketing narrative.
Offer Strategy
Typical agent: Focuses primarily on highest price.
Specialist team: Evaluates the full structure—timelines, contingencies, financing certainty, and inspection posture.
Why it matters: In competitive Silicon Valley ZIP codes, deal structure often determines the winning offer.
Buyer Intelligence
Typical agent: Reactive—responding to showing requests.
Specialist team: Proactive scouting, pre-inspection strategies, and escalation planning.
Why it matters: Competitive markets reward buyers who are strategically prepared before submitting offers.
Repair & Inspection Narrative
Typical agent: Treated as a routine disclosure package.
Specialist team: Provides a clear architectural diligence narrative addressing typical Eichler systems and materials.
Why it matters: Reduces buyer fear and minimizes renegotiation during escrow.
Negotiation Approach
Typical agent: Negotiation primarily around price.
Specialist team: Negotiation structured around risk transfer—contingency design, deadline leverage, and deal certainty.
Why it matters: Protects seller proceeds and reduces escrow volatility.
Network Effect
Typical agent: Limited network reach.
Specialist team: Broad buyer pipelines combined with local and cross-market referral networks.
Why it matters: In supply-constrained neighborhoods, broader buyer exposure can materially improve pricing outcomes.
The “why hire this team” business case (stated as benefits, not hype)
For Silicon Valley luxury transactions, the rational case for a specialist team operating model is that it aims to produce one of two outcomes—ideally both:
Higher certainty (fewer surprises, cleaner escrow, lower renegotiation exposure), especially when building‑science questions are predictable.
Higher effective demand (more qualified bidders who understand the product), especially in a micro‑market where design buyers behave differently than generic single‑family buyers.
Those outcomes matter because, in high‑velocity ZIP dynamics, mistakes are expensive: the market moves quickly, and strategic missteps can force price reductions or timeline extensions that are hard to reverse.
Methodology and data notes
Primary and official sources were prioritized where accessible: an archival project record (UC Berkeley EDA) for origins and authorship; City of Sunnyvale pages for parks; Caltrain and VTA pages/PDFs for transit; CA Model Grid outputs for Dashboard indicator snapshots; and Redfin ZIP/neighborhood market pages for market statistics and sold‑home details (Redfin reports that its calculations draw on MLS and/or public records).
Where requested datasets could not be extracted in full fidelity (notably Ed‑Data enrollment time‑series charts embedded as images within the page structure), this report anchored on the most recent published enrollment point (2024–25) and modeled the prior four years with an explicitly stated decline assumption consistent with district planning commentary indicating downward enrollment pressure.
Comparable sales were selected to reflect design‑comparable Eichler inventory in the same micro‑area and restricted to 2024–2025 closed sales. Every comp row is source‑cited to a public sale detail page.